Top Penny Stocks


Company AI Score Fundamental Technical Alternative Price Price YTD Industry
CTRM Castor Maritime
CTRM
7
9
3
9
$2.37 2.6% Marine Shipping
FIGS FIGS
FIGS
7
8
5
7
$4.7 8.4% Apparel - Manufacturers
BBAI BigBear.ai
BBAI
7
2
6
9
$3.04 18.2% Information Technology Services
No logo Sign up to get access
6
7
6
5
$3.92 14.8% Software - Infrastructure
No logo Sign up to get access
6
3
5
7
$4.06 5.5% Telecommunications Services
No logo Sign up to get access
6
6
5
6
$4.33 1.7% Auto - Parts
No logo Sign up to get access
6
7
4
6
$3.43 8% Medical - Instruments & Supplies
No logo Sign up to get access
6
1
2
9
$1.47 18.5% Biotechnology
No logo Sign up to get access
6
7
3
7
$4 12.3% Medical - Devices
No logo Sign up to get access
6
1
3
10
$0.0636 56% Biotechnology
No logo Sign up to get access
6
6
5
6
$2.96 4.4% Internet Content & Information
No logo Sign up to get access
6
3
8
6
$2.81 13.6% Electrical Equipment & Parts
No logo Sign up to get access
6
1
3
8
$1.5 51.2% Aerospace & Defense
No logo Sign up to get access
6
3
2
7
$4.98 16.6% Renewable Utilities
No logo Sign up to get access
6
6
4
6
$3.71 10% Biotechnology
No logo Sign up to get access
6
5
3
7
$2.32 3% Financial - Capital Markets
No logo Sign up to get access
5
7
6
3
$2.24 13.7% Consumer Electronics
No logo Sign up to get access
5
1
6
4
$2.9 223.8% Broadcasting
No logo Sign up to get access
5
3
6
5
$2.96 5.5% Specialty Retail
No logo Sign up to get access
5
2
5
5
$2.32 11.6% Auto - Manufacturers
No logo Sign up to get access
5
3
3
6
$4.73 2.8% Apparel - Retail
No logo Sign up to get access
5
3
6
5
$1.56 14.3% Luxury Goods
No logo Sign up to get access
5
8
4
3
$1.79 6.9% Drug Manufacturers - Specialty & Generic
No logo Sign up to get access
5
8
6
4
$4.19 3.5% Medical - Pharmaceuticals
No logo Sign up to get access
5
2
7
5
$4.73 30.7% Internet Content & Information
No logo Sign up to get access
5
2
7
5
$2.59 56.1% Specialty Retail
No logo Sign up to get access
5
8
5
5
$4.74 9.4% Specialty Retail
No logo Sign up to get access
5
1
2
6
$0.389 27.1% Apparel - Retail
No logo Sign up to get access
5
2
5
5
$4.8 15.2% Airlines, Airports & Air Services
No logo Sign up to get access
5
3
3
6
$1.59 2.7% Internet Content & Information
No logo Sign up to get access
5
2
5
6
$2.63 0.00% Auto - Parts
No logo Sign up to get access
5
4
6
4
$4.57 1.3% Software - Application
No logo Sign up to get access
5
4
3
6
$3.91 3.8% Household & Personal Products
No logo Sign up to get access
5
5
3
6
$4.12 10.1% Auto - Parts
No logo Sign up to get access
5
8
5
4
$4.45 7.9% Rental & Leasing Services
No logo Sign up to get access
5
4
5
5
$1.35 17.5% Rental & Leasing Services
No logo Sign up to get access
5
2
5
5
$1.82 12.1% Medical - Specialties
No logo Sign up to get access
5
2
4
7
$1.15 21.4% Oil & Gas Equipment & Services
No logo Sign up to get access
5
2
2
7
$1.96 9.7% Biotechnology
No logo Sign up to get access
5
1
6
5
$3.47 12.4% Software - Application
No logo Sign up to get access
5
8
6
4
$3.11 5.7% Software - Application
No logo Sign up to get access
5
3
6
6
$3.61 18.7% Oil & Gas Equipment & Services
No logo Sign up to get access
5
4
5
6
$2.39 4.5% Communication Equipment
No logo Sign up to get access
5
4
5
6
$2.17 3.1% Oil & Gas Exploration & Production
No logo Sign up to get access
5
1
5
8
$0.49 149.3% Biotechnology
No logo Sign up to get access
5
2
3
10
$0.8001 36.4% Integrated Freight & Logistics
No logo Sign up to get access
5
1
4
6
$1.08 4.8% Auto - Manufacturers
No logo Sign up to get access
5
4
3
5
$0.8427 3.4% Financial - Capital Markets
No logo Sign up to get access
5
1
2
8
$4.32 16.8% Biotechnology
No logo Sign up to get access
5
3
5
7
$2.7 42.8% Biotechnology
No logo Sign up to get access
5
7
6
4
$3.29 20.5% Biotechnology
No logo Sign up to get access
5
2
4
10
$2.69 2.4% Medical - Devices
No logo Sign up to get access
5
2
5
7
$0.9106 9.3% Computer Hardware
No logo Sign up to get access
5
1
2
9
$0.25 0.2% Biotechnology
No logo Sign up to get access
5
7
6
4
$1.72 32.1% Industrial Materials
No logo Sign up to get access
5
2
2
7
$0.6887 13.3% Biotechnology
No logo Sign up to get access
5
7
5
4
$1.86 5.5% Biotechnology
No logo Sign up to get access
5
2
4
7
$3.14 23.4% Biotechnology
No logo Sign up to get access
5
4
4
5
$4.3 2.2% Software - Application
No logo Sign up to get access
5
5
5
5
$2.06 30.6% Household & Personal Products
No logo Sign up to get access
5
1
6
7
$3.91 23.2% Semiconductors
No logo Sign up to get access
4
4
3
4
$3.03 4% Information Technology Services
No logo Sign up to get access
4
2
2
5
$2.19 2.4% Apparel - Retail
No logo Sign up to get access
4
1
6
5
$1.21 13.7% Hardware, Equipment & Parts
No logo Sign up to get access
4
3
3
4
$3.87 5.5% Restaurants
No logo Sign up to get access
4
1
5
5
$0.982 25.6% Drug Manufacturers - Specialty & Generic
No logo Sign up to get access
4
3
4
7
$3.2 2.1% Oil & Gas Drilling
No logo Sign up to get access
4
2
3
3
$2.88 19.4% Entertainment
No logo Sign up to get access
4
2
3
4
$3.75 3.2% Auto - Manufacturers
No logo Sign up to get access
4
7
3
3
$0.4996 13.4% Personal Products & Services
No logo Sign up to get access
4
1
3
5
$1.13 8.8% Real Estate - Services
No logo Sign up to get access
4
4
5
4
$3.25 12.1% Apparel - Retail
No logo Sign up to get access
4
7
4
3
$4.85 17.1% Consumer Electronics
No logo Sign up to get access
4
1
3
8
$1.25 5.5% Biotechnology
No logo Sign up to get access
4
3
7
3
$1.47 14.6% Software - Infrastructure
No logo Sign up to get access
4
2
4
5
$0.7995 8.1% Biotechnology
No logo Sign up to get access
4
2
4
5
$4.86 2.2% Packaged Foods
No logo Sign up to get access
4
4
7
3
$3.59 41.3% Medical - Healthcare Plans
No logo Sign up to get access
4
3
3
4
$3.94 5.7% Telecommunications Services
No logo Sign up to get access
4
7
4
4
$4.6 7.8% Software - Application
No logo Sign up to get access
4
2
5
4
$4.7 5.1% Publishing
No logo Sign up to get access
4
2
5
4
$1.13 143.6% Restaurants
No logo Sign up to get access
4
3
2
5
$3.69 26.3% Entertainment
No logo Sign up to get access
4
3
5
4
$1.4 1.6% Specialty Retail
No logo Sign up to get access
4
3
4
4
$3.8 8% Apparel - Retail
No logo Sign up to get access
4
2
3
5
$1.01 19.5% Specialty Retail
No logo Sign up to get access
4
4
4
4
$2.93 5.8% Internet Content & Information
No logo Sign up to get access
4
7
4
5
$2.7 0.00% Industrial Materials
No logo Sign up to get access
4
1
3
5
$1 12.9% Aerospace & Defense
No logo Sign up to get access
4
4
2
4
$1.79 15.3% Internet Content & Information
No logo Sign up to get access
4
2
4
4
$4.59 7.3% Rental & Leasing Services
No logo Sign up to get access
4
2
6
5
$4.99 7.3% Computer Hardware
No logo Sign up to get access
4
2
6
5
$2.37 12.5% Medical - Devices
No logo Sign up to get access
4
1
5
4
$1.3 7.6% Medical - Devices
No logo Sign up to get access
4
1
5
4
$2.88 2.5% Software - Application
No logo Sign up to get access
4
2
1
6
$1.25 13.3% Auto - Parts
No logo Sign up to get access
4
3
4
4
$2.52 8.7% Communication Equipment
No logo Sign up to get access
4
7
5
3
$2.59 11.4% Medical - Instruments & Supplies
No logo Sign up to get access
4
2
4
4
$4.94 5.6% Software - Application
No logo Sign up to get access
4
3
3
4
$0.443 37.8% Software - Application
No logo Sign up to get access
4
4
4
5
$3.31 16.8% Solar
No logo Sign up to get access
4
2
3
7
$0.7298 13.8% Advertising Agencies
No logo Sign up to get access
4
2
6
4
$2.84 45% Software - Application
No logo Sign up to get access
4
3
4
5
$3.39 5.2% Auto - Manufacturers
No logo Sign up to get access
4
2
3
6
$0.686 2.9% Medical - Devices
No logo Sign up to get access
4
8
2
2
$1.68 4% Computer Hardware
No logo Sign up to get access
4
2
5
4
$1.14 14.8% Chemicals - Specialty
No logo Sign up to get access
4
3
3
6
$0.2721 8.8% Medical - Devices
No logo Sign up to get access
4
2
5
4
$1.99 11.2% Software - Application
No logo Sign up to get access
4
2
3
5
$0.0026 25.7% Packaged Foods
No logo Sign up to get access
4
7
4
3
$2.31 25% Software - Application
No logo Sign up to get access
4
1
4
8
$1.08 34.4% Software - Infrastructure
No logo Sign up to get access
4
2
2
6
$3.65 2.7% Biotechnology
No logo Sign up to get access
4
2
6
5
$1.91 21.1% Biotechnology
No logo Sign up to get access
4
1
3
5
$2.5 26.1% Solar
No logo Sign up to get access
4
1
5
7
$1.59 4.8% Medical - Diagnostics & Research
No logo Sign up to get access
4
1
5
4
$1.18 42.9% Real Estate - Services
No logo Sign up to get access
4
1
5
7
$3.35 15.1% Biotechnology
No logo Sign up to get access
4
2
4
5
$1.58 11% Biotechnology
No logo Sign up to get access
4
1
2
5
$0.2175 7.7% Software - Application
No logo Sign up to get access
4
1
1
6
$0.2135 31.9% Waste Management
No logo Sign up to get access
4
3
1
5
$0.115 75.8% Auto - Manufacturers
No logo Sign up to get access
4
1
6
4
$2.34 8.5% Real Estate - Services
No logo Sign up to get access
4
2
3
6
$0.1876 47.4% Industrial - Machinery
No logo Sign up to get access
4
1
5
5
$0.5081 6% Biotechnology
No logo Sign up to get access
4
6
3
0
$0.8101 65.7% Hardware, Equipment & Parts
No logo Sign up to get access
4
1
2
6
$0.2422 45% Waste Management
No logo Sign up to get access
4
5
5
3
$2.28 1.6% Beverages - Alcoholic
No logo Sign up to get access
4
6
2
3
$1.2 11.4% Chemicals - Specialty
No logo Sign up to get access
4
1
3
7
$2 13.4% Biotechnology
No logo Sign up to get access
4
1
2
9
$1.21 11.4% Biotechnology
No logo Sign up to get access
3
3
2
3
$0.6629 7.5% Education & Training Services
No logo Sign up to get access
3
2
4
3
$2.12 14.3% Computer Hardware
No logo Sign up to get access
3
1
3
3
$2.82 0.1% Furnishings, Fixtures & Appliances
No logo Sign up to get access
3
2
3
3
$1.62 29.9% Oil & Gas Refining & Marketing
No logo Sign up to get access
3
2
2
5
$0.9856 25.9% Drug Manufacturers - Specialty & Generic
No logo Sign up to get access
3
2
5
4
$4.43 12.9% Drug Manufacturers - Specialty & Generic
No logo Sign up to get access
3
2
4
3
$4.5 32.4% Electronic Gaming & Multimedia
No logo Sign up to get access
3
3
3
3
$1.45 3.4% Drug Manufacturers - Specialty & Generic
No logo Sign up to get access
3
2
3
3
$0.6903 7.3% Consumer Electronics
No logo Sign up to get access
3
2
3
4
$0.4732 35.8% Broadcasting
No logo Sign up to get access
3
3
6
3
$1.64 18.2% Broadcasting
No logo Sign up to get access
3
2
4
3
$1.03 6.8% Drug Manufacturers - Specialty & Generic
No logo Sign up to get access
3
2
4
4
$0.6262 8.5% Agricultural Farm Products
No logo Sign up to get access
3
4
4
3
$3.8 12.4% Internet Content & Information
No logo Sign up to get access
3
2
6
3
$4.16 15.6% Rental & Leasing Services
No logo Sign up to get access
3
4
3
2
$4.5 4.1% Medical - Healthcare Information Services
No logo Sign up to get access
3
3
2
3
$0.6063 5.5% Medical - Diagnostics & Research
No logo Sign up to get access
3
3
3
3
$2.94 9.5% Publishing
No logo Sign up to get access
3
3
3
3
$3.65 12.9% Restaurants
No logo Sign up to get access
3
3
5
3
$1.12 0.00% Luxury Goods
No logo Sign up to get access
3
3
3
3
$0.831 7.9% Travel Services
No logo Sign up to get access
3
2
2
3
$2.31 4.1% Apparel - Footwear & Accessories
No logo Sign up to get access
3
1
3
4
$2.59 9.9% Semiconductors
No logo Sign up to get access
3
1
7
3
$4.91 2.1% Furnishings, Fixtures & Appliances
No logo Sign up to get access
3
4
4
3
$1.32 11% Specialty Retail
No logo Sign up to get access
3
2
4
3
$0.7512 59% Furnishings, Fixtures & Appliances
No logo Sign up to get access
3
1
2
4
$2.02 8.6% Agricultural - Machinery
No logo Sign up to get access
3
2
5
3
$2.25 10.5% Internet Content & Information
No logo Sign up to get access
3
4
6
2
$3.14 12.2% Broadcasting
No logo Sign up to get access
3
2
4
3
$2.82 16.5% Specialty Retail
No logo Sign up to get access
3
2
4
4
$1.39 0.5% Banks - Regional
No logo Sign up to get access
3
1
2
4
$1.19 14.2% Financial - Mortgages
No logo Sign up to get access
3
1
2
4
$0.35 20.6% Biotechnology
No logo Sign up to get access
3
2
3
4
$4.92 4.3% Biotechnology
No logo Sign up to get access
3
2
3
4
$0.623 16.7% Medical - Diagnostics & Research
No logo Sign up to get access
3
2
3
4
$0.8268 11.7% Home Improvement
No logo Sign up to get access
3
2
4
3
$1.14 14.8% Medical - Devices
No logo Sign up to get access
3
2
5
4
$0.8049 11.8% Software - Application
No logo Sign up to get access
3
2
3
4
$0.16 0.00% Software - Application
No logo Sign up to get access
3
1
2
3
$4.08 9.5% Biotechnology
No logo Sign up to get access
3
1
3
3
$0.7317 1.5% Software - Application
No logo Sign up to get access
3
2
2
4
$0.3795 59% Biotechnology
No logo Sign up to get access
3
3
5
3
$1.48 66.1% Staffing & Employment Services
No logo Sign up to get access
3
1
2
4
$0.9391 15.7% Biotechnology
No logo Sign up to get access
3
2
3
5
$0.7721 7.5% Biotechnology
No logo Sign up to get access
3
2
5
0
$1.08 9.8% Grocery Stores
No logo Sign up to get access
3
2
3
5
$1.65 18.4% Biotechnology
No logo Sign up to get access
3
2
2
5
$1.75 0.3% Biotechnology
No logo Sign up to get access
3
3
3
3
$0.9601 23.8% Auto - Manufacturers
No logo Sign up to get access
3
1
2
4
$1.55 13.6% Biotechnology
No logo Sign up to get access
3
1
2
6
$2.79 2.4% Drug Manufacturers - Specialty & Generic
No logo Sign up to get access
3
2
3
3
$4.55 20.4% Medical - Healthcare Information Services
No logo Sign up to get access
3
3
5
3
$4.59 7.8% Oil & Gas Midstream
No logo Sign up to get access
3
4
4
2
$1.32 3.8% Household & Personal Products
No logo Sign up to get access
3
2
3
3
$1.51 19.4% Medical - Diagnostics & Research
No logo Sign up to get access
3
2
2
6
$4.51 56.3% Software - Application
No logo Sign up to get access
3
1
1
5
$0.5 45.3% Biotechnology
No logo Sign up to get access
3
2
6
2
$1.47 12.8% Biotechnology
No logo Sign up to get access
3
2
3
3
$1.12 3.1% Solar
No logo Sign up to get access
3
2
4
3
$1.58 1.2% Oil & Gas Exploration & Production
No logo Sign up to get access
3
1
3
4
$1.19 8.7% Biotechnology
No logo Sign up to get access
3
1
2
4
$2.94 17.4% Security & Protection Services
No logo Sign up to get access
3
1
1
5
$1.12 0.00% Biotechnology
No logo Sign up to get access
3
1
4
3
$2.26 9.2% Biotechnology
No logo Sign up to get access
3
6
4
0
$2.48 8.3% Oil & Gas Exploration & Production
No logo Sign up to get access
3
1
3
4
$0.862 27.2% Biotechnology
No logo Sign up to get access
3
2
7
3
$4.57 11.2% Computer Hardware
No logo Sign up to get access
3
2
4
3
$1.48 3.9% Medical - Healthcare Information Services
No logo Sign up to get access
3
2
6
2
$1.15 31.6% Software - Infrastructure
No logo Sign up to get access
3
2
4
3
$2.58 16.5% Aerospace & Defense
No logo Sign up to get access
3
2
6
3
$3.66 8.5% Biotechnology
No logo Sign up to get access
3
2
3
3
$0.8506 2.8% Auto - Manufacturers
No logo Sign up to get access
2
1
3
3
$0.97 10.1% Specialty Retail
No logo Sign up to get access
2
3
4
1
$1.29 4.3% Specialty Retail
No logo Sign up to get access
2
2
2
2
$4.7 16% Electrical Equipment & Parts
No logo Sign up to get access
2
2
3
1
$3.14 7.2% Packaged Foods
No logo Sign up to get access
2
1
3
3
$1.34 11.7% Electrical Equipment & Parts
No logo Sign up to get access
2
3
4
0
$0.6627 21.8% Drug Manufacturers - Specialty & Generic
No logo Sign up to get access
2
2
3
2
$0.6185 9% Specialty Retail
No logo Sign up to get access
2
1
4
0
$0.4402 16.5% Biotechnology
No logo Sign up to get access
2
1
2
3
$1.94 23.8% Auto - Manufacturers
No logo Sign up to get access
2
2
3
2
$1.38 8.6% Software - Application
No logo Sign up to get access
2
2
3
2
$0.369 18.4% Financial - Capital Markets
No logo Sign up to get access
2
2
2
2
$2.9 70.3% Medical - Diagnostics & Research
No logo Sign up to get access
2
2
5
1
$1.4 30.4% Specialty Retail
No logo Sign up to get access
2
3
3
2
$1.69 5.4% Furnishings, Fixtures & Appliances
No logo Sign up to get access
2
2
3
2
$1.11 3.7% Electronic Gaming & Multimedia
No logo Sign up to get access
2
2
2
3
$4.16 2.4% Biotechnology
No logo Sign up to get access
2
3
3
2
$0.781 7.8% Airlines, Airports & Air Services
No logo Sign up to get access
2
1
2
3
$2.3 8.8% Biotechnology
No logo Sign up to get access
2
3
3
2
$2.95 24% Software - Application
No logo Sign up to get access
2
1
2
5
$1.55 4.4% Biotechnology
No logo Sign up to get access
2
1
2
4
$0.414 33.4% Drug Manufacturers - Specialty & Generic
No logo Sign up to get access
2
1
3
3
$3.38 5.1% Biotechnology
No logo Sign up to get access
2
2
3
2
$0.152 77.4% Electrical Equipment & Parts
No logo Sign up to get access
2
3
4
1
$0.726 21.8% Entertainment
No logo Sign up to get access
2
2
2
3
$1.85 14.8% Advertising Agencies
No logo Sign up to get access
2
2
3
3
$4.92 7.5% Software - Application
No logo Sign up to get access
2
1
2
3
$1.32 5.3% Biotechnology
No logo Sign up to get access
2
2
3
2
$2.81 19% Auto - Dealerships
No logo Sign up to get access
2
2
2
3
$1.06 9.1% Biotechnology
No logo Sign up to get access
2
1
4
2
$0.3138 9.4% Biotechnology
No logo Sign up to get access
2
1
2
4
$1.71 99.4% Biotechnology
No logo Sign up to get access
2
2
5
2
$0.026 50.4% Software - Application
No logo Sign up to get access
2
2
4
3
$0.0001 95% Software - Application
No logo Sign up to get access
2
1
2
3
$1.18 1% Biotechnology
No logo Sign up to get access
2
3
3
2
$1.43 1.3% Drug Manufacturers - Specialty & Generic
No logo Sign up to get access
2
1
4
3
$0.39 0.4% Software - Infrastructure
No logo Sign up to get access
1
1
2
2
$1.73 10.9% Biotechnology
No logo Sign up to get access
1
1
3
1
$3.01 23.5% Aerospace & Defense
No logo Sign up to get access
1
1
3
1
$0.9359 12.2% Engineering & Construction
No logo Sign up to get access
1
1
3
0
$0.8 13.1% Drug Manufacturers - Specialty & Generic
No logo Sign up to get access
1
1
1
0
$1.65 2.1% Biotechnology


TrendEdge identifies the top stocks to buy today in the Penny Stocks category using AI scores based on fundamental data, technical analysis, and alternative data insights. This powerful approach highlights the top stocks to buy now, helping investors find the best opportunities in 2025.

Discover Data-Powered Penny Stocks


Every stock at TrendEdge is assigned an AI score, offering a clear signal of its potential. These scores are powered by thousands of data points, including fundamental data, technical analysis, and alternative data insights.
By ranking stocks based on their AI scores, we shine a light on standout penny stocks across diverse industries. Our insights spark fresh ideas and inspire investors to explore new market opportunities.

What sets the Top Stocks at TrendEdge apart is our ability to integrate not only traditional fundamental and technical analyses but also multiple streams of alternative data. This includes insights from web traffic, social media trends, employee sentiment, and more, providing a comprehensive view of a company's performance and potential.

TrendEdge provides analysis on over 6,000 stocks spanning a wide range of industries and markets. Whether you're looking at technology giants, healthcare innovators, or emerging players in niche sectors, TrendEdge ensures you have access to the data you need. This global coverage allows investors to explore diverse opportunities, diversify their portfolios, and get an edge in the market.

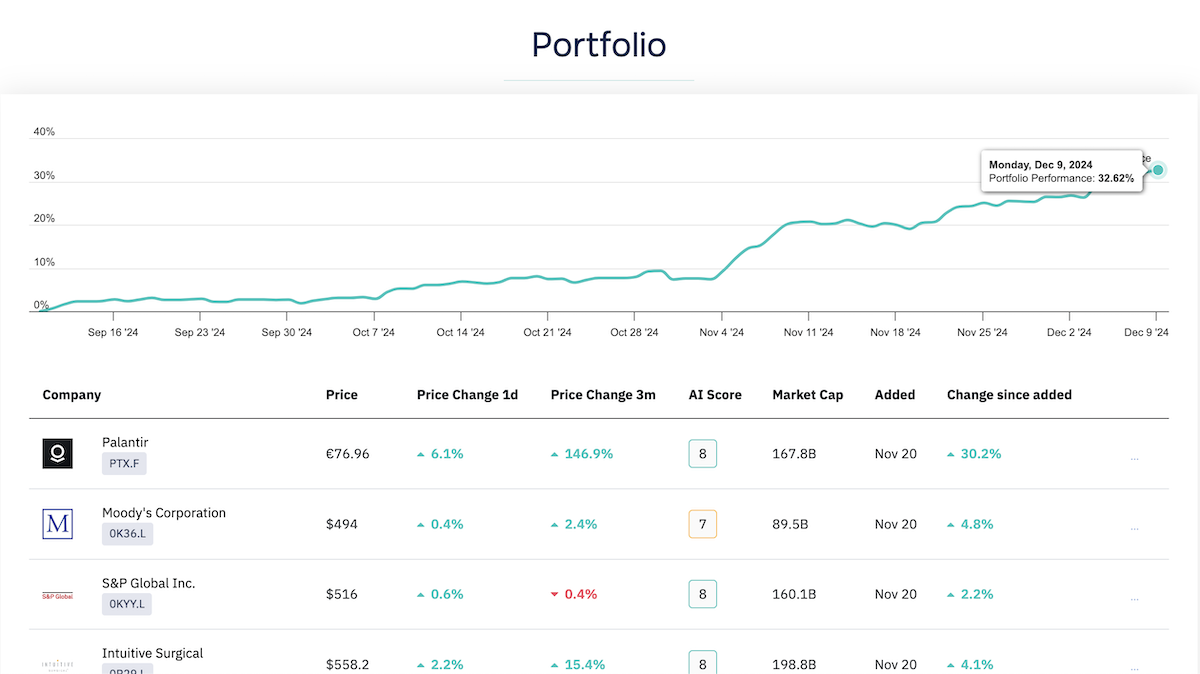
Top Stock Portfolio Performance

"I have only put Top Stocks in my portfolio, I’m amazed with the results"

Top Penny Stocks Performance


AXNX BigBear.ai
BBAI

Price

$3.04

Price Change (3m)

27.8%

AXNX QuantumScape
QS

Price

$4.33

Price Change (3m)

27.2%

AXNX FIGS
FIGS

Price

$4.7

Price Change (3m)

21.8%

AXNX Castor Maritime
CTRM

Price

$2.37

Price Change (3m)

17.7%

AXNX Ribbon Communications
RBBN

Price

$4.06

Price Change (3m)

1%

AXNX BlackBerry
BB

Price

$3.92

Price Change (3m)

0.3%

On average, the 6 most highly rated top stocks in the Penny Stocks category have declined -15.9% over the last 3 months, signaling potential upsides ahead. Amongst the 6 top stocks in the Penny Stocks category, BlackBerry has had the best return, up 0.3% in the last 3 months.

Top Penny Stocks - FAQ


What are the Top Stocks in the Penny Stocks category to watch Today?

As of the latest update, Castor Maritime, FIGS, and BigBear.ai are among the top stocks with high AI scores. These stocks in the Penny Stocks category show strong potential for market outperformance, making them attractive options for investors looking for gains.

Why Choose TrendEdge's Top Penny Stocks?

TrendEdge Top Penny Stocks are ranked by AI scores based on thousands of data signals, including fundamental data, technical analysis, and alternative data insights. This unique approach identies the best-performing companies and stocks, helping investors quickly find top opportunities and smarter investments.

How Often is the AI Score Updated?

Our AI score for all stocks in the Penny Stocks category is updated daily to reflect the latest market data, financial insights, and alternative data points. This ensures that our stock rankings provide investors with the most current insights and trends for better decision-making.

Can I Filter Top Stocks by Sector?

Yes! At TrendEdge, you can filter the top stocks by sector to customise your stock list based on industries that interest you. From Technology and Healthcare to Energy and Consumer Defensive, we offer detailed stock insights across all sectors.

How do I Stay updated on Top Penny Stocks to buy?

Every week, we notify our members via email on the current top stocks. This list is provided via email and contains updated top stocks along with their current stock price, change in price and AI score.

How do I Sign up to access more Top Penny Stocks?

Easy, sign up via our sign up page and get instant access to Top Penny Stocks, AI analysis, stock alerts, portfolio management and much more.