Limited-Time October Offer: Try 7 Days for Free

Top Stocks to Watch Now


The stock market offers a wide range of companies that may align with different investment strategies. Whether you're interested in growth-oriented names or value-focused companies, identifying strong candidates requires careful research and attention to evolving market trends. This list highlights notable stocks to watch in 2025, featuring companies with strong data signals and potential across various industries.

Company AI Score Fundamental Technical Alternative Price Price YTD Industry
CRNX Crinetics Pharmaceuticals
CRNX
9
7
7
10
$44.05 44.3% Biotechnology
AMD AMD
AMD
8
8
8
6
$218.1 44.8% Semiconductors
LMT Lockheed Martin
LMT
8
7
7
8
$505.2 11.2% Aerospace & Defense
No logo Sign up to get access
8
8
6
7
$179.7 147.2% Software - Infrastructure
No logo Sign up to get access
8
7
3
8
$187.7 26.9% Software - Application
No logo Sign up to get access
8
8
5
8
$412.2 3.7% Biotechnology
No logo Sign up to get access
8
10
7
8
$138.3 45.8% Semiconductors
No logo Sign up to get access
8
9
5
8
$318.3 18.6% Medical - Devices
No logo Sign up to get access
8
9
7
8
$389.6 51.3% Renewable Utilities
No logo Sign up to get access
8
9
5
6
$1025.7 48.5% Semiconductors
No logo Sign up to get access
8
9
6
7
$89.54 24.3% Financial - Data & Stock Exchanges
No logo Sign up to get access
8
10
7
7
$220.7 42.8% Hardware, Equipment & Parts
No logo Sign up to get access
8
9
4
8
$196 1.8% Railroads
No logo Sign up to get access
8
6
6
9
$27.29 17% Semiconductors
No logo Sign up to get access
8
8
7
8
$292.9 60.9% Engineering & Construction
No logo Sign up to get access
8
8
4
8
$38.04 25.2% Software - Infrastructure
No logo Sign up to get access
8
6
9
9
$20.89 1.7% Financial - Capital Markets
No logo Sign up to get access
8
9
9
8
$34.94 22.7% Biotechnology
No logo Sign up to get access
8
10
8
8
$171.2 73.1% Gold
No logo Sign up to get access
8
8
7
9
$674.1 39.4% Engineering & Construction
No logo Sign up to get access
8
7
8
8
$69.83 7.2% Biotechnology
No logo Sign up to get access
8
6
9
10
$174.1 269.6% Regulated Electric
No logo Sign up to get access
8
6
8
9
$5.64 5.7% Chemicals - Specialty
No logo Sign up to get access
8
6
7
9
$9.05 14.3% Semiconductors
No logo Sign up to get access
7
8
5
5
$513.6 25.6% Software - Infrastructure
No logo Sign up to get access
7
8
5
7
$247.8 8.3% Consumer Electronics
No logo Sign up to get access
7
8
6
6
$68.66 20.6% Communication Equipment
No logo Sign up to get access
7
9
5
7
$173.9 2.9% Semiconductors
No logo Sign up to get access
7
9
5
7
$657.2 13.5% Software - Application
No logo Sign up to get access
7
7
5
7
$161.7 0.1% Semiconductors
No logo Sign up to get access
7
9
6
7
$218.2 15.9% Semiconductors
No logo Sign up to get access
7
9
5
6
$113.3 34% Auto - Parts
No logo Sign up to get access
7
9
3
8
$225.1 23.3% Financial - Data & Stock Exchanges
No logo Sign up to get access
7
8
3
6
$208.6 3.9% Conglomerates
No logo Sign up to get access
7
9
5
6
$78.04 18.3% Hardware, Equipment & Parts
No logo Sign up to get access
7
8
5
7
$155 28.3% Technology Distributors
No logo Sign up to get access
7
9
5
6
$213.2 20.9% Education & Training Services
No logo Sign up to get access
7
7
5
8
$812.4 17.2% Drug Manufacturers - General
No logo Sign up to get access
7
7
6
6
$249.3 12.9% Hardware, Equipment & Parts
No logo Sign up to get access
7
8
4
7
$20.31 2.5% Biotechnology
No logo Sign up to get access
7
8
6
7
$61.85 15.9% Agricultural Farm Products
No logo Sign up to get access
7
8
7
7
$108.3 71.4% Gold
No logo Sign up to get access
7
8
5
5
$94.25 52.1% Software - Application
No logo Sign up to get access
7
8
4
7
$34.36 15.9% Gambling, Resorts & Casinos
No logo Sign up to get access
7
9
6
6
$38.31 8.1% Specialty Retail
No logo Sign up to get access
7
8
5
6
$287.7 31% Medical - Healthcare Information Services
No logo Sign up to get access
7
9
6
7
$96.54 15.3% Medical - Devices
No logo Sign up to get access
7
7
5
5
$5280.1 9.9% Travel Services
No logo Sign up to get access
7
9
5
6
$52.11 11.8% Entertainment
No logo Sign up to get access
7
8
6
7
$180.1 13.9% Apparel - Retail
No logo Sign up to get access
7
7
4
5
$65.8 9.4% Packaged Foods
No logo Sign up to get access
7
10
5
7
$202.1 11.3% Software - Application
No logo Sign up to get access
7
5
5
7
$60.5 60.1% Aerospace & Defense
No logo Sign up to get access
7
8
2
6
$15.31 14.1% Software - Infrastructure
No logo Sign up to get access
7
8
8
6
$164.8 13.7% Communication Equipment
No logo Sign up to get access
7
7
5
7
$83.42 6.8% Asset Management
No logo Sign up to get access
7
7
3
7
$78.84 54.7% Medical - Devices
No logo Sign up to get access
7
9
4
7
$117.4 9% Integrated Freight & Logistics
No logo Sign up to get access
7
4
4
8
$162.5 8.4% Financial - Capital Markets
No logo Sign up to get access
7
9
5
7
$187.3 23.6% Information Technology Services
No logo Sign up to get access
7
8
6
7
$261.2 26.8% Medical - Instruments & Supplies
No logo Sign up to get access
7
9
3
7
$147 34.6% Information Technology Services
No logo Sign up to get access
7
9
3
7
$29.83 18% Auto - Parts
No logo Sign up to get access
7
7
4
8
$85.32 40.4% Medical - Devices
No logo Sign up to get access
7
9
4
7
$254.9 4.7% Medical - Devices
No logo Sign up to get access
7
7
6
7
$35.39 17.3% Medical - Instruments & Supplies
No logo Sign up to get access
7
8
8
7
$7.04 10.9% Oil & Gas Equipment & Services
No logo Sign up to get access
7
8
6
7
$85.96 18.2% Biotechnology
No logo Sign up to get access
7
8
8
7
$86.95 49.2% Solar
No logo Sign up to get access
7
9
4
7
$68.82 4.6% Industrial - Machinery
No logo Sign up to get access
7
8
6
6
$175.6 27.4% Security & Protection Services
No logo Sign up to get access
7
9
5
6
$65.4 26.2% Tobacco
No logo Sign up to get access
7
8
5
7
$185.8 2.6% Industrial - Machinery
No logo Sign up to get access
7
7
5
7
$704.7 29.3% Aerospace & Defense
No logo Sign up to get access
7
4
3
8
$69.58 26.3% Oil & Gas Midstream
No logo Sign up to get access
7
9
5
7
$736.5 18.2% Industrial - Machinery
No logo Sign up to get access
7
7
6
8
$431.6 23.9% Engineering & Construction
No logo Sign up to get access
7
7
5
7
$56.89 24.9% Personal Products & Services
No logo Sign up to get access
7
10
5
7
$486.7 12.3% Financial - Data & Stock Exchanges
No logo Sign up to get access
7
7
4
8
$122.3 32.8% Medical - Instruments & Supplies
No logo Sign up to get access
7
8
6
7
$144.1 10.4% Apparel - Retail
No logo Sign up to get access
7
9
5
8
$169.3 30.8% REIT - Healthcare Facilities
No logo Sign up to get access
7
9
5
7
$481.3 9% Financial - Data & Stock Exchanges
No logo Sign up to get access
7
7
4
7
$298.1 33.9% Trucking
No logo Sign up to get access
7
7
8
6
$21.98 7.7% Software - Application
No logo Sign up to get access
7
8
4
7
$39.47 23.1% Specialty Retail
No logo Sign up to get access
7
5
3
8
$30.79 0.1% Oil & Gas Midstream
No logo Sign up to get access
7
8
7
6
$121 7.1% Semiconductors
No logo Sign up to get access
7
7
6
6
$123.5 24.4% Biotechnology
No logo Sign up to get access
7
5
5
9
$45.34 14.1% Asset Management
No logo Sign up to get access
7
6
6
9
$11.21 4.3% Shell Companies
No logo Sign up to get access
7
9
6
7
$148.7 6.4% Consulting Services
No logo Sign up to get access
7
9
4
7
$51.48 10.7% Software - Infrastructure
No logo Sign up to get access
7
8
6
7
$238.9 5.3% Construction Materials
No logo Sign up to get access
7
9
7
6
$395 76% Engineering & Construction
No logo Sign up to get access
7
7
7
7
$358.3 41.3% Software - Application
No logo Sign up to get access
7
3
5
8
$38.95 3.5% Oil & Gas Midstream
No logo Sign up to get access
7
9
7
6
$101.2 1.3% Luxury Goods
No logo Sign up to get access
7
7
7
7
$68.22 7.3% Industrial Materials
No logo Sign up to get access
7
9
7
7
$554.7 41.4% Aerospace & Defense


TrendEdge uses AI scores — powered by fundamental data, technical indicators, and alternative data insights — to surface stocks showing notable signals. This data-driven approach helps users explore high-potential companies and stay informed about current market activity in 2025.

Explore Top Stocks in Every Market


Every stock on TrendEdge is assigned an AI Score — a data-driven metric derived from thousands of inputs, including fundamental data, technical indicators, and alternative data insights. These scores help surface stocks showing strong signals across multiple sectors, allowing users to explore companies that stand out based on a wide range of factors.
By ranking stocks based on their AI scores, we can highlight the current top stocks across multiple sectors, making it easier for investors to identify the best opportunities in the market.

What sets the Top Stocks at TrendEdge apart is the integration of traditional financial metrics with multiple streams of alternative data. This includes web traffic trends, social media activity, employee sentiment, and other non-traditional indicators — offering a broader perspective on a company's market presence and activity.

TrendEdge provides data and insights on over 6,000 stocks across a wide range of industries and global markets. From technology leaders and healthcare innovators to emerging companies in niche sectors, our platform offers access to a diverse set of metrics and signals. This broad coverage supports deeper market exploration and helps users analyze companies across different regions and sectors.

Top Stock Portfolio Performance

"I have only put Top Stocks in my portfolio, I’m amazed with the results"

Top Stocks Performance


AXNX POET Technologies
POET

Price

$9.05

Price Change (3m)

35.3%

AXNX Lightwave Logic
LWLG

Price

$5.64

Price Change (3m)

209.9%

AXNX Oklo
OKLO

Price

$174.1

Price Change (3m)

170.5%

AXNX Crinetics Pharmaceuticals
CRNX

Price

$44.05

Price Change (3m)

38.1%

AXNX Palantir
PLTR

Price

$179.7

Price Change (3m)

19.1%

AXNX AMD
AMD

Price

$218.1

Price Change (3m)

36.2%

On average, the 6 most highly rated top stocks have soared 84.9% over the last 3 months, showing strong upward momentum. Amongst the 6 top stocks, Lightwave Logic has had the best return, up 209.9% in the last 3 months.

TrendEdge: Smarter Market Research with AI-Driven Insights

Comprehensive Stock Coverage

TrendEdge provides data and insights on over 6,000 stocks across global exchanges, helping users explore companies in industries ranging from technology and healthcare to emerging markets and niche sectors.

AI-Powered Stock Scoring

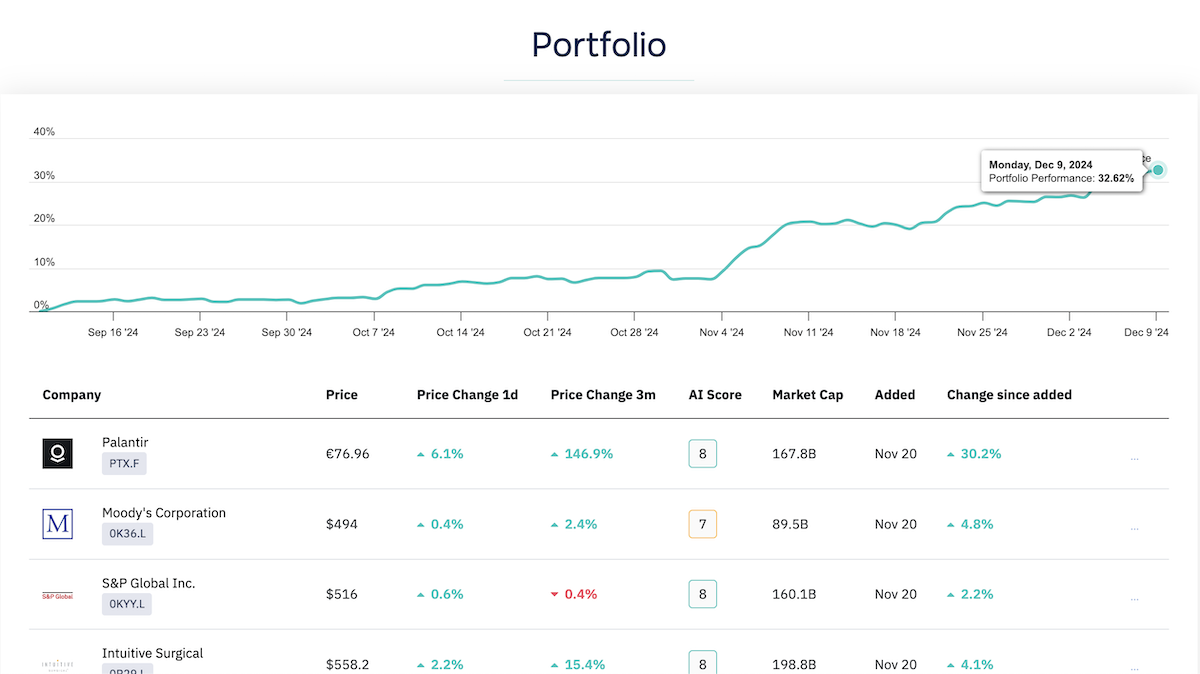
Each stock is evaluated with an AI Score (0–10), calculated using thousands of data points — including fundamental metrics, technical indicators, and alternative data like web traffic, app downloads, and social sentiment. These scores highlight noteworthy signals and support deeper market research.

Alternative Data Integration

TrendEdge combines traditional and alternative data streams to offer a broader perspective on market activity. Users can track social media trends, employee sentiment, search traffic, and more — helping to surface potential developments earlier than traditional sources.

Research Tools for Every Strategy

Whether you're analyzing growth stocks, value-oriented companies, dividend payers, or high-volatility sectors like AI and renewable energy, TrendEdge equips you with real-time data to explore a wide range of investment themes.

Custom Signals & Analytics

The platform allows users to customize their experience by filtering signals based on sectors, risk preferences, or trading strategies. From long-term trend analysis to short-term signal alerts, TrendEdge supports a range of research needs.

Cross-Market Coverage

TrendEdge analyzes multiple financial markets including equities, commodities, currencies, and crypto, giving users access to a wide array of data across asset classes.

Who It’s For

  • Retail investors looking to expand their research toolkit
  • Traders seeking real-time alerts based on AI-generated insights
  • Professionals who rely on fast, clean, and data-rich tools
  • Beginners aiming to understand market trends without the noise

Education & Transparency

In addition to real-time signals, TrendEdge offers educational resources, market overviews, and customizable dashboards to help users understand the data behind each signal — without speculation or hype.

FAQ Summary

What’s the best stock to buy now?

There’s no single best stock for every investor. TrendEdge helps you explore companies showing strong signals based on AI and alternative data.

What sectors are trending in 2025?

AI, fintech, renewable energy, and biotechnology are currently attracting strong interest due to innovation and market demand.

Does TrendEdge give buy/sell advice?

No. TrendEdge provides data and AI-powered scores to support market research. It does not offer investment advice or make buy/sell recommendations.

How accurate are TrendEdge’s signals?

AI signals are based on real-time analysis of market and alternative data. While they highlight patterns and momentum, no signal guarantees performance.

Can I customize signals?

Yes. Users can tailor TrendEdge alerts based on trading preferences, strategies, and sectors of interest.